
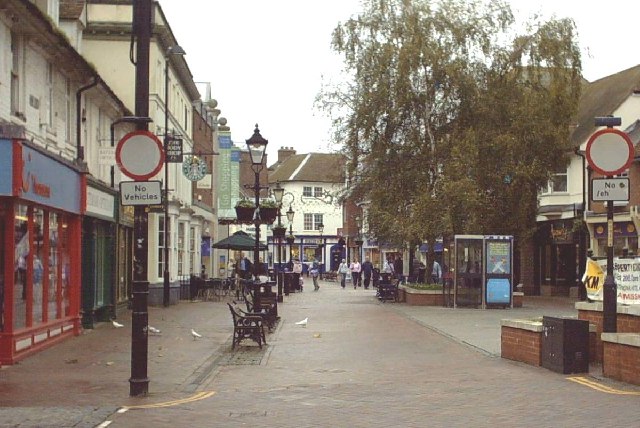
Key findings
- Bus Network Accessibility Plans (Bus NAPs) must be published by English local transport authorities by 1 April 2027. Used well, they can identify the journey barriers that limit access to town-centre jobs, services, independent businesses and evening activity.
- Recent footfall evidence points to fragile and uneven demand, not an automatic high-street recovery. Accessibility should therefore be treated as a way to improve the quality and reliability of local demand, rather than as a stand-alone retail-growth intervention.
- The strongest 2027–29 strategy is a joined-up operating model: accessible bus journeys, safe routes from stops, an offer worth travelling for, clear delivery ownership and recurring management capacity. Failure in any one element weakens the economic return from the others.
Thesis: accessibility is becoming a practical test of whether regeneration can generate use
**Forecast horizon: April 2027 to October 2029.** England’s town-centre challenge is no longer simply to renew physical fabric. It is to make centres usable often enough, by enough different people, to support local businesses, services, employment and civic life. The imminent publication deadline for Bus Network Accessibility Plans (Bus NAPs) creates an unusually concrete test of whether transport, planning and regeneration decisions are being made as one system.
Every English local transport authority must publish a Bus NAP by 1 April 2027. Department for Transport guidance requires authorities to assess whether people can use local bus services independently, safely and in reasonable comfort, and to identify improvements across the journey experience (Department for Transport, 2026) ↗. That requirement is principally about accessibility and equal participation. Its economic importance is that town-centre demand depends on the same end-to-end journey: finding information, reaching a stop, waiting safely, boarding, interchanging, walking to a destination and getting home at a usable time.
For SMEs and local employers, this is not an abstract infrastructure issue. An inaccessible or unreliable journey can reduce the pool of customers, constrain recruitment, shorten evening trading and make a centre less attractive to independent operators. Conversely, accessible travel can widen the group able to use a centre independently. It does not guarantee spending, but it can remove a preventable barrier to participation.
The present demand picture makes that distinction important. Office for National Statistics data indicated that town-and-city-centre footfall in September 2026 was broadly unchanged from a year earlier, while falling 6% from August; the series is not seasonally adjusted, so the monthly movement should not be treated as a clean trend (Office for National Statistics, 2026) ↗. Separately, BRC-Sensormatic reported high-street footfall down 3.0% year on year in September 2026, compared with falls of 1.7% at retail parks and 3.5% at shopping centres (British Retail Consortium, 2026) ↗. The measures are not interchangeable and should not be combined into a single estimate. Taken together, they nevertheless argue against an assumption of broad, self-sustaining recovery.
**Sanctuary interpretation:** the central question for 2027–29 is not whether a town centre has a regeneration masterplan. It is whether residents, workers and visitors can make the journeys that turn the plan into regular activity. Bus NAPs are a timely mechanism for testing that proposition against real places and real trips.
Why the 2027 deadline creates a narrow but useful decision window
Bus NAPs matter because the guidance reaches beyond the vehicle itself. It encompasses services, stops, stations, information, ticketing and connections with other modes, and expects engagement with disabled people. It also distinguishes between specific commitments and longer-term ambitions dependent on funding (Department for Transport, 2026) ↗. This is a valuable discipline for town-centre policy, where strategies often blur the difference between an intended outcome and a funded, owned intervention.
The wider policy framework strengthens the case for integration. Local Transport Plan guidance asks authorities to develop evidence-based plans that connect transport to wider outcomes and partner working. It also sets out the expanded local tools available following the Bus Services Act 2025, including franchising, enhanced partnerships, local authority bus companies and the accessibility-plan duty (Department for Transport, 2026) ↗. Meanwhile, national planning policy requires policies to promote the vitality and viability of town centres, and favours edge- and out-of-centre development that is accessible and well connected to centres by sustainable transport (Ministry of Housing, Communities and Local Government, 2026) ↗.
There is a corresponding regeneration window. The Pride in Place programme is backed by up to £5.8 billion over 10 years, with an initial investment period from 2026–27 to 2029–30. Its guidance allows places to refine delivery in response to engagement, match funding and practical delivery conditions (Ministry of Housing, Communities and Local Government, 2026) ↗. That does not make the programme a replacement for bus revenue funding, nor does it imply that every town can finance its ambitions through it. It does mean public-realm, activation and community-investment choices can be informed by better evidence about who can reach a centre, by which routes, and at what times.
The practical risk is institutional separation. A transport authority may identify inaccessible stops and poor interchange; a district council may commission public-realm works; a business improvement district may focus on events and safety; and local employers may struggle with staffing after early evening. Each response can be reasonable in isolation. Without a shared view of the user journey, however, investment may improve individual assets while leaving the trip itself unworkable.
**Sanctuary recommendation:** each priority centre should have a short, jointly owned access-to-activity schedule before the Bus NAP is finalised. It should identify the most important origins, interchange points, routes from stops to destinations, first- and last-service gaps, resting and toilet provision, and barriers after dark. For every priority issue, the schedule should name an owner, a delivery date, a cost range and the relevant funding dependency. This is more useful than adding another high-level strategy to an already crowded policy landscape.
The economic mechanism: necessary access, insufficient on its own
The strongest case for accessibility is conditional, not deterministic. Better transport does not automatically create retail sales, reduce vacancy or rescue a weak local offer. The Department for Transport’s review of transport investment and local growth finds that land use, institutions, planning and local development conditions shape whether investment contributes to transformational change (Department for Transport, 2024) ↗.
The relevant causal chain has four links. First, accessible and reliable journeys can expand the pool of potential users: shoppers, workers, patients, students, visitors and people attending civic or cultural activity. Second, the centre needs a credible reason to visit, whether that is everyday services, a market, health provision, hospitality, workspace, culture or a distinctive independent-business offer. Third, the public realm and operating environment must make arrival feel safe and straightforward. Finally, local management must sustain the offer through coordination, events, business support and responsive problem-solving. A failure at any point can limit the value generated by the others.
This is why a single-mode debate about parking charges, bus mileage or capital works is too narrow. Written evidence to Parliament from Professor Cathy Parker notes that the available research does not show a simple causal relationship between parking charges and either footfall or economic performance. It identifies public transport, evening activity, destination attractiveness and the retail offer among the factors relevant to town-centre performance (Parker, 2026) ↗. Parking may matter greatly in particular places and for particular trips; the evidence instead cautions against treating it as a universal explanation or remedy.
Vacancy data also underline the need to segment centres rather than prescribe a standard retail-led response. Average 2025 vacancy across London high streets and town centres was 9.3%, compared with 10.3% in the rest of the UK, but these are descriptive averages rather than forecasts for individual places (Greater London Authority, 2026) ↗. A centre anchored by health, education or civic services will have different access needs from a visitor economy destination, a market town or a comparison-shopping centre.
**Sanctuary interpretation:** accessibility interventions should be tied to a named demand segment and use case. Examples might include older residents travelling to daytime services, disabled residents making independent journeys, hospitality workers returning after late shifts, families attending weekend events, or rail users connecting to a cultural venue. This changes the question from “how do we improve access?” to “what specifically prevents this group from making, completing and repeating this journey?”
Three scenarios for 2027–29
**Base case: selective stabilisation.** Most English centres are likely to see uneven demand rather than a general footfall rebound. Authorities meet the April 2027 Bus NAP requirement, but the quality and fundability of delivery vary. Better-performing places focus on a limited number of priority centres and manageable improvements: clear information, accessible waiting environments, safe crossings, legible interchange and services that reflect actual opening, closing and shift patterns. Footfall may remain volatile, but selected places improve repeat use, dwell time and the reliability of customer and workforce access.
**Upside case: access-led local value.** A smaller group of places uses Bus NAP evidence to align bus policy, Local Transport Plans, public-realm works, planning decisions, evening programming and SME support. The objective is not simply more bus provision; it is dependable access to a distinctive centre when that centre is active. Where this is paired with strong stewardship, it can reduce practical risk for independent traders, community operators and employers by making the place easier for customers and staff to use. National planning policy and the 2026–30 Pride in Place investment period can reinforce this coordination, but neither policy framework guarantees it (Ministry of Housing, Communities and Local Government, 2026) ↗ ↗.
**Downside case: compliance without usable journeys.** Plans identify barriers but contain few funded commitments. Public-realm schemes are designed separately from stops and interchanges. Services end before workers or evening visitors can return home, while businesses face continued weak demand. In this scenario, a town centre may receive visible capital investment without converting it into repeat activity or stronger local trading conditions. The subdued September 2026 footfall readings make this a credible risk, although they should not be read as a definitive forecast for every centre (Office for National Statistics, 2026; British Retail Consortium, 2026) ↗ ↗.
These are not numerical forecasts. They are decision scenarios intended to clarify dependencies: usable access, a viable offer, local demand, delivery capability and ongoing operating resource. The policy error would be to fund the most visible element while assuming the remaining links will resolve themselves.
What leaders should measure, and what would disprove the thesis
A meaningful dashboard should track outcomes by centre, time of day and user group rather than relying solely on annual footfall. The first test is whether draft Bus NAPs identify barriers at named town-centre stops, stations and interchanges, rather than describing the network only at authority level. The second is delivery credibility: the proportion of actions with an accountable owner, cost range, funding source and implementation date. The distinction between commitments and ambitions is explicit in the Bus NAP guidance and should be visible in local reporting (Department for Transport, 2026) ↗.
Other useful measures include first- and last-service timings against employment, hospitality, culture, market and health-service hours; pedestrian-route quality between stops and key destinations; passenger feedback; vacancy; event attendance; and locally appropriate proxies for independent-business performance. Data should be interpreted carefully. A rise in footfall alone does not establish that transport caused the change, and a short-term fall may reflect weather, seasonality or event timing. The aim is to use several indicators to identify where journey friction is suppressing activity and whether changes improve the experience for intended users.
There are legitimate counterarguments. Some centres may already have good physical access but lack a competitive offer, affordable premises, relevant skills or occupier demand. In others, the core constraint may be the revenue required to sustain frequent services, rather than the quality of accessibility planning. Bus NAPs cannot resolve those problems independently. The thesis would be weakened if local evidence showed that access barriers are low, services operate reliably at relevant times, and poor performance is principally explained by weak demand or an uncompetitive offer. It would also weaken if plans remain detached from network, investment and planning decisions, functioning only as descriptive compliance documents.
**Practical next step:** councils, transport authorities, business groups and neighbourhood boards should complete a six-week access-to-activity audit for each priority centre. Map the five highest-value destination journeys; test them in daytime and evening conditions with disabled residents, workers and regular users; identify the breakpoints; and publish a short list of funded changes with a quarterly scorecard. This is a proportionate way to turn a statutory accessibility duty into local economic intelligence—and to distinguish a credible regeneration programme from a collection of disconnected projects.
Research foundation
References
- Department for Transport (2026). Creating and managing a bus network accessibility plan (Bus NAP). GOV.UK.Source ↗
- Department for Transport (2026). Local transport plans. GOV.UK.Source ↗
- Office for National Statistics (2026). UK retail footfall. Office for National Statistics.Source ↗
- British Retail Consortium (2026). Budget must deliver for shoppers as footfall drops. British Retail Consortium.Source ↗
- Ministry of Housing, Communities and Local Government (2026). National Planning Policy Framework, Chapter 8: Ensuring the vitality of town centres (TC1–4). GOV.UK.Source ↗
- Ministry of Housing, Communities and Local Government (2026). Pride in Place programme: delivery guidance. GOV.UK.Source ↗
- Department for Transport (2024). Impacts of transport investment on local growth. GOV.UK.Source ↗
- Cathy Parker (2026). Written evidence on the sustainability of retail, hospitality and the night-time economy. UK Parliament Committees.Source ↗
- Greater London Authority City Intelligence (2026). State of London: Economy. London Datastore.Source ↗
- Adam Colton. Hero image: Ashford Town Centre - Upper High Street - geograph.org.uk - 74845.jpg. Wikimedia Commons · CC BY-SA 2.0.Image source ↗
Related Sanctuary capabilities
From analysis to implementation.
Discussion
No approved comments yet.