
Key findings
- England’s starts have recovered from their 2024 low, but completions remain well below their 2021 peak. This is evidence of an uneven recovery in conversion, not yet a broad-based delivery surge.
- The planning pipeline is becoming more strategically active: proposed units in outline applications rose sharply, while detailed residential applications declined. The near-term construction pipeline is therefore weaker than headline outline-unit numbers imply.
- For higher-risk buildings, improving Gateway 2 performance reduces one source of uncertainty, but Gateway 3 remains a consequential test of whether schemes can complete without late-stage evidence and handover delays.
- Materials inflation, labour competition and competing infrastructure demand can turn viable consented schemes into delayed projects. These pressures matter most where design, procurement and utility arrangements remain unresolved.
- The practical advantage in 2027–28 will sit with organisations that manage housing as a conversion system: from consent and design assurance to utilities, procurement, workforce, compliance evidence and completion.
The thesis: housing delivery now depends less on permission volume than on conversion capacity
**Forecast horizon: late 2026 to the end of 2028.** England has a plausible route to a stronger housebuilding market, but not an automatic one. Planning reform, a recovery in starts and a more supportive policy direction can create more opportunities to build. They cannot, by themselves, ensure that schemes are financeable, serviced, technically approvable, staffed and capable of reaching completion.
That distinction matters now because the housing system is showing two different signals. Annual new-build starts in England reached an estimated 136,330 in the year to June 2026, up 15% year on year. Completions, however, were 143,770: unchanged on the prior year and 21% below the June 2021 peak of 181,940. In 2026 Q2, starts rose to 35,910 while completions fell 3% on the preceding quarter to 35,800. These building-control-based measures cover around 80% of housebuilding, so they are best treated as timely indicators rather than a complete final count. Nonetheless, the divergence is material: projects are entering construction faster than the system is yet demonstrating an ability to lift completed-home output. (MHCLG, 2026) ↗
The broader construction backdrop reinforces the need for caution. Great Britain construction output fell by 1.0% in the three months to August 2026, and private new housing output fell by 3.2%. A subdued market can release capacity in some trades and supply chains, which is a potential upside for build-ready projects. But it also means that a rise in starts should not be mistaken for proof of a self-sustaining residential recovery. (ONS, 2026) ↗
**Sanctuary’s assessment** is that 2027 will be a year of conversion discipline. The key question for councils, developers, housing associations, contractors and lenders is not simply how many homes are proposed or permitted. It is how many sites can move through the post-consent chain without reopening their cost plan, losing programme certainty or encountering an avoidable technical and infrastructure constraint. This is where management capability becomes an economic issue: weak coordination converts policy ambition into dormant land; strong coordination converts it into homes, jobs and local spend.
Planning is expanding the opportunity set, but the buildable pipeline is not yet moving at the same pace
The policy setting is more supportive than it was during the recent downturn. The Planning and Infrastructure Act and the revised National Planning Policy Framework are intended to create a clearer, more rules-based route to delivery. That can reduce avoidable uncertainty and improve the supply of sites and infrastructure over time. It should nevertheless be understood as an enabling reform, not a forecast of starts or completions on individual schemes. (MHCLG, 2026) ↗
The planning data illustrate why. In the year to June 2026, outline applications contained 246,000 proposed residential units, 41% more than a year earlier, despite a 6% fall in the number of outline applications. Detailed residential applications covered 274,000 units, down 8%. The most defensible interpretation is not that the market lacks interest in development. Rather, larger strategic propositions are returning to the system more quickly than the design-resolved applications that provide a nearer-term signal of mobilisation. (MHCLG, 2026) ↗
This distinction is central to a credible 2027–28 outlook. An outline application is useful evidence of land-market intent and future demand for consultants, enabling works and infrastructure. It is not a dependable forecast of a construction start. Between outline consent and a viable programme sit land assembly, reserved matters and conditions, affordable-housing obligations, drainage, utilities, highways, procurement, funding and—where relevant—building-control approval. Any one of these can change a scheme’s value, sequencing or delivery model.
There is also a local competition effect. The UK Infrastructure Pipeline includes projects at construction, development and pre-project stages across public and private infrastructure. It is a valuable indication of prospective demand, but it is not a committed timetable for every scheme included. Its importance for housing is geographical: energy, transport, water, health and other programmes can draw on the same regional design teams, specialist trades, plant and materials as residential projects. (National Infrastructure and Service Transformation Authority, 2025) ↗
The counterargument is that more permissions are still necessary; that is correct. Planning delay can constrain delivery and reform may unlock sites that would otherwise remain inactive. The analytical error is to stop there. For the next two years, the practical differentiator will be the share of the planning pipeline that is genuinely build-ready, rather than merely policy-aligned or consented.
The binding constraints lie after consent: compliance evidence, inputs and skills
For higher-risk residential buildings, the Building Safety Regulator’s performance is now a direct programme variable. The latest published Gateway 2 data for new higher-risk buildings and conversions recorded 57 decisions in the 12 weeks to 5 October 2026, with a 96% approval rate and a median approval time of 23 weeks. Yet 186 cases, representing 40,644 units, remained in progress; complex cases had a median approval time of 34 weeks. The regulator also linked an increase in September applications to submissions ahead of the building-safety levy taking effect on 1 October 2026. (Building Safety Regulator, 2026) ↗
This is better news than a simple narrative of regulatory blockage would suggest. Gateway 2 throughput has improved, and a high approval rate indicates that properly prepared applications can progress. However, it is not evidence that the end-to-end process has been proven at scale. Gateway 3 is the completion-stage control. Earlier data reported that no new-build schemes which had passed Gateway 2 had yet reached Gateway 3, making the transition from approved design to completed, evidenced building a live risk for the 2027 pipeline. (Building Safety Regulator, 2026) ↗
The operational implication is clear: the golden thread, product information, inspection records and change control need to be managed as part of the production system, not assembled as a handover exercise. For contractors and smaller specialist firms, this raises an important capability question. SMEs may be well placed to supply local labour and specialist expertise, but they need the quality systems, records and cash-flow resilience required by a more evidence-intensive market.
Costs create a second conversion challenge. The all-work construction-materials price index was 6.4% higher in August 2026 than a year earlier. Within that average, fabricated structural steel was up 21.2%, rigid pipes and fittings 15.5%, and reinforcing bars 12.5%. Brick deliveries were down 10.1% and concrete-block deliveries down 6.5% year on year. Lower deliveries can reflect weak demand rather than an imminent shortage, so they should not be treated as a supply-crisis indicator. They do, however, show why broad inflation assumptions are insufficient for live projects with concentrated exposure to particular assemblies. (Department for Business and Trade, 2026) ↗
Labour is the third constraint. CITB expects UK construction output to fall 0.2% in 2026 before growing by 1.8% in 2027 and 2.8% in 2028. It identifies infrastructure, public new housing and private new housing among the growth segments and estimates an average annual requirement for 41,200 additional construction workers over 2026–30. This is a modelled workforce requirement, not a measure of current vacancies, and it applies to the UK rather than England alone. Even so, it supports a credible risk: if housing and infrastructure recover together, recruitment and retention will become more difficult in the same places where delivery ambitions are highest. (CITB, 2026) ↗
Three scenarios for 2027–28: gradual recovery remains the central case
**Base case — gradual and uneven improvement.** Starts continue to recover from their low base, while a proportion of the enlarged strategic pipeline moves into detailed design, enabling works and construction. Output improves broadly in line with CITB’s national 2027–28 outlook, but housing completions respond more slowly than starts because projects still need to resolve technical, commercial and infrastructure dependencies. Schemes with mature designs, secure funding and realistic cost allowances outperform marginal projects dependent on optimistic sales values or unresolved obligations. This is the central case because it fits both the recovery in starts and the continuing weakness in completions and private new-housing output. (MHCLG, 2026; ONS, 2026; CITB, 2026) ↗ ↗ ↗
**Upside case — build-ready projects convert at pace.** Planning reform reduces pre-construction uncertainty, detailed applications recover, Gateway 2 performance remains stable as volumes rise, and Gateway 3 develops predictable treatment for new-build projects. Material-cost pressure moderates and delivery teams use repeatable design, early supply-chain engagement and disciplined change control. Starts would then strengthen through 2027, with the more meaningful effect on completions arriving later in 2027 and into 2028. This is an inference from the available planning, regulatory and workforce evidence, not an official forecast. (MHCLG, 2026; Building Safety Regulator, 2026) ↗ ↗
**Downside case — recovery stalls at mobilisation.** Inflation, finance costs and weaker affordability impair viability, while projects face labour competition, price volatility or late compliance changes. In September 2026, the Bank of England maintained Bank Rate at 3.75% and expected CPI inflation to rise to around 3¾% in 2026 Q4 and slightly above 4% in 2027 Q1, based on energy prices prevailing in mid-September. If that pressure persisted, it could affect contractor pricing, household purchasing power and investment decisions at the same time. (Bank of England, 2026) ↗
The base case should therefore not be read as a prediction that every consented scheme will proceed. It is a conditional judgement: the market can improve, but the pace of improvement will be set by conversion capability rather than planning activity alone.
What to monitor—and what delivery leaders should do now
Four indicators will show whether the central case is holding. First, detailed residential applications and building-control starts need to rise together; that would indicate that strategic intent is becoming near-term work. Second, Gateway 2 decision times and cases in progress should be monitored alongside tangible evidence that new-build schemes can clear Gateway 3. Third, project teams should track exposure to specific cost-sensitive assemblies, rather than relying on a single headline materials index. Fourth, local housing trajectories should be tested against infrastructure programmes competing for the same workforce and supply chain. (MHCLG, 2026; Building Safety Regulator, 2026; Department for Business and Trade, 2026) ↗ ↗ ↗ ↗ ↗
Signals that would weaken the base case include a renewed fall in starts, continued deterioration in detailed applications, a rising Gateway caseload without matching decisions, or materials inflation that remains above assumptions embedded in tendered schemes. The Bank’s inflation and rate outlook is a cross-cutting indicator because it affects both project finance and buyer affordability. (Bank of England, 2026) ↗
**Sanctuary recommendations.** Local authorities and delivery partners should publish a concise build-readiness schedule alongside their housing trajectory. Each strategic site should have named owners and a red-amber-green assessment of land control, conditions, utilities, drainage, technical approvals, procurement, workforce and funding. This would make the difference between a nominal pipeline and a managed delivery portfolio visible early enough to act on it.
Developers and housing providers should create a single evidence plan that joins design assurance, construction records, product data, inspection activity and handover. Programme boards should also maintain an assembly-level materials register, with explicit triggers for redesign, early procurement or contingency release. These are not administrative additions: they are means of protecting completion dates and reducing the risk that SMEs absorb unmanaged change without the contractual or financial capacity to do so.
Finally, councils, contractors, colleges and local enterprise partners should map demand for critical trades against nearby infrastructure programmes. Earlier routes into employment, clearer pipelines for subcontractors and shared visibility of future demand can improve local economic value while reducing a foreseeable productivity constraint.
England’s housing opportunity through 2028 is real, but it will reward organisations that can prove a project is ready to build and ready to complete. More permissions remain necessary. The nearer-term prize, however, lies in removing the constraints that prevent permissions from becoming homes.
Research foundation
References
- Ministry of Housing, Communities and Local Government (2026). Housing supply: indicators of new supply, England: April to June 2026. GOV.UK.Source ↗
- Office for National Statistics (2026). Construction output in Great Britain: August 2026. Office for National Statistics.Source ↗
- Ministry of Housing, Communities and Local Government (2026). Creating a clear, rules-based planning system. GOV.UK.Source ↗
- Ministry of Housing, Communities and Local Government (2026). Planning applications in England: April to June 2026. GOV.UK.Source ↗
- National Infrastructure and Service Transformation Authority (2025). UK Infrastructure Pipeline. GOV.UK.Source ↗
- Building Safety Regulator (2026). Building Safety Regulator building control approval application data: July to September 2026. GOV.UK.Source ↗
- Building Safety Regulator (2026). Building Safety Regulator building control approval application data: May to July 2026. GOV.UK.Source ↗
- Department for Business and Trade (2026). Construction building materials: commentary September 2026. GOV.UK.Source ↗
- Construction Industry Training Board (2026). Construction Workforce Outlook: Labour Market Intelligence Report 2026 to 2030. CITB.Source ↗
- Bank of England Monetary Policy Committee (2026). Bank Rate maintained at 3.75%: September 2026 Monetary Policy Summary and Minutes. Bank of England.Source ↗
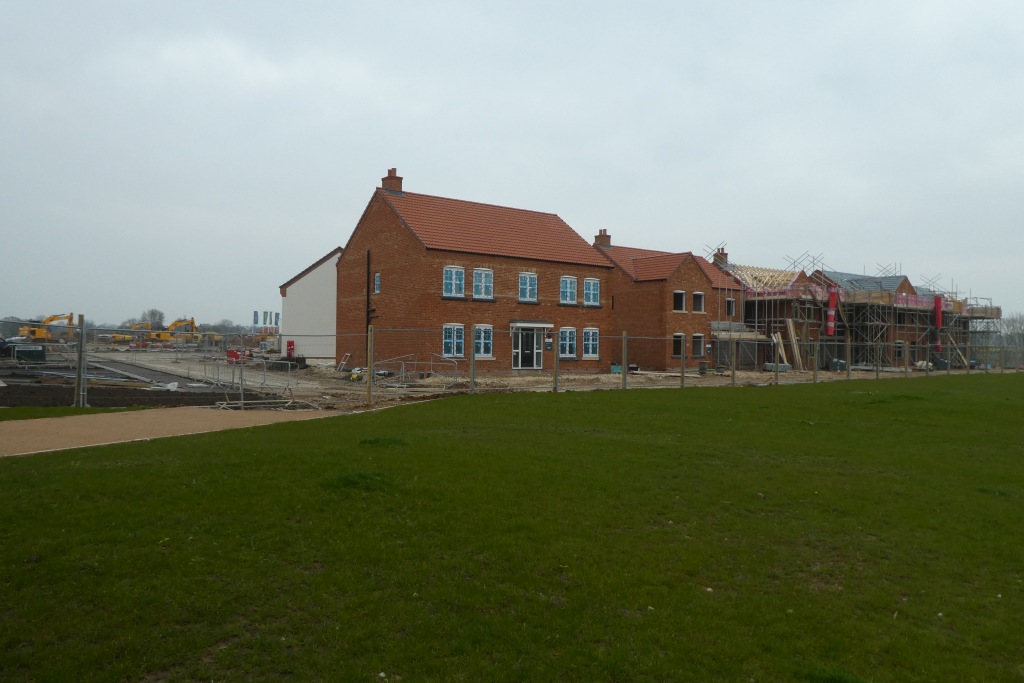
- DS Pugh. Hero image: Housing construction - geograph.org.uk - 7148470.jpg. Wikimedia Commons · CC BY-SA 2.0.Image source ↗
Related Sanctuary capabilities
From analysis to implementation.
Discussion
No approved comments yet.