
Key findings
- The UK’s £298 billion Defence Investment Plan and rising medium-term defence-spending trajectory improve demand visibility, but neither is a direct forecast of suppliers’ revenue, margins or cash flow.
- Babcock, Chemring and QinetiQ provide materially different exposures: naval and nuclear support, energetics capacity, and test-and-evaluation infrastructure. Their key risks are therefore not interchangeable.
- The central analytical question for 2026–28 is whether policy commitments pass through a chain of programme approval, contract award, mobilisation, customer acceptance and cash conversion without material cost leakage.
- For SMEs and local economies, defence demand can create durable value only where firms build qualified, transferable capability rather than investing speculatively against a broad policy narrative.
The thesis: UK defence has become an execution story
**Forecast horizon: November 2026 to October 2028.** The case for higher UK defence expenditure is now clearer than it was a year ago. The Defence Investment Plan sets out £298 billion of investment over four years. Budget 2026 states the Government’s intention to reach defence spending of 3% of GDP in 2030 and 3.5% by 2035. The Office for Budget Responsibility forecasts NATO-qualifying defence spending rising from 2.6% of GDP in 2026–27 to 2.7% in 2029–30 and 3.0% in 2030–31. (GOV.UK, 2026) ↗ (GOV.UK, 2026) ↗ (GOV.UK, 2026) ↗
That matters for the UK because the prospective demand reaches beyond major platform manufacturers. It can support naval infrastructure, maintenance, specialist manufacturing, testing, assurance, software, logistics and skills. Yet the investable and operational implication is more demanding than the headline suggests: a departmental spending path is not the same thing as a supplier’s executable revenue.
The conversion chain is the key mechanism. Public commitments must become prioritised programmes, funded contracts, workable technical specifications, mobilised workforces, accepted deliveries and ultimately cash receipts. Friction at any stage can delay revenue or reduce returns. A business may have substantial backlog but still face thin margins, working-capital pressure or a provision if the programme was priced poorly or capacity was not ready.
**Sanctuary view:** the relevant question through 2028 is not simply which companies are associated with defence spending. It is which businesses can convert verified customer demand into repeatable, cash-generative delivery while retaining discipline on cost, capital and risk.
How to distinguish a policy opportunity from an earnings opportunity
The Defence Investment Plan provides a more concrete demand framework than strategic rhetoric alone, while Budget 2026 links delivery to industry contracts, supply-chain expansion, skills and procurement reform. Those are constructive conditions, but they do not remove the normal constraints of programme management. (GOV.UK, 2026) ↗ (GOV.UK, 2026) ↗
A useful assessment therefore has five tests.
1. **Funding and timing:** is expected work contracted and scheduled, or is it an addressable pipeline dependent on later decisions?
2. **Capacity and labour:** can sites, suppliers and security-cleared technical teams support higher output without undue cost inflation or delay?
3. **Contract quality:** are specifications, risk allocation and customer-acceptance conditions sufficiently mature to protect margin?
4. **Cash conversion:** does growth require a manageable level of inventory, work in progress and capital expenditure before cash is collected?
5. **Capital allocation:** will new capacity create a lasting strategic position, or merely absorb capital during a temporary rush of demand?
This framework also qualifies a common bullish argument. Backlog is valuable, but it is not a uniform measure of earnings quality. Long-duration support work may provide visibility, while a fixed-price development programme can carry significant delivery risk. Likewise, an increase in defence spending may be economically important without immediately benefiting every listed supplier: its effect depends on programme mix, award timing and each company’s place in the supply chain.
There is a counterargument. Investment in qualified facilities, specialist people and regulated processes can create barriers to entry that make near-term expenditure worthwhile even before utilisation is fully visible. That can be true. But it raises the evidential bar: management must show that capacity is being commissioned, orders are converting and cash generation is recovering, rather than relying on a favourable sector narrative.
Babcock: long-duration naval support, with programme-risk discipline still essential
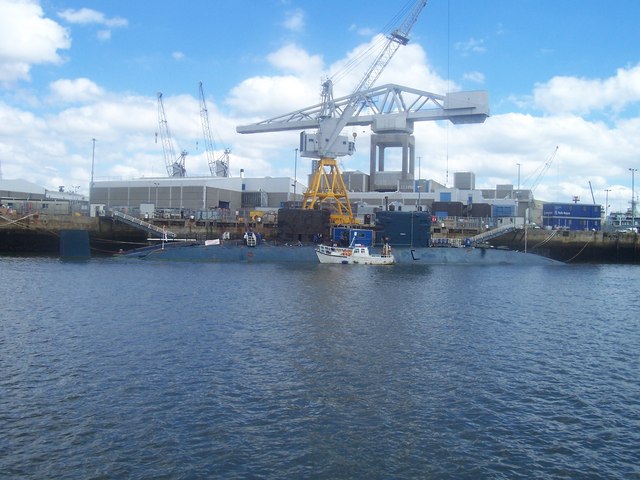
Babcock’s appeal lies in mission-critical support rather than dependence on a single new-build order. In its September trading update, it described itself as the sole through-life support provider for the UK nuclear submarine fleet and the incumbent site operator at HMNB Devonport and HMNB Clyde. It also highlighted the Government’s £26 billion, ten-year Royal Oak programme for naval infrastructure, including £7 billion for Devonport and £15 billion for Clyde. (Babcock International Group, 2026) ↗
That positioning gives Babcock a plausible route to the infrastructure and availability requirements associated with a larger naval and nuclear enterprise. Support activities can carry longer customer relationships and more recurring demand than an isolated equipment award. But this should not be mistaken for immunity from execution risk. Babcock’s FY26 results included a £140 million Type 31 charge. The group reported underlying operating profit of £293.3 million; excluding the charge, the equivalent figure was £433.3 million. Contract backlog was £9.8 billion at 31 March 2026, compared with £10.4 billion a year earlier. (Babcock International Group, 2026) ↗
The practical issue is whether high-value naval-support opportunities can be mobilised while Type 31 cost issues remain contained. At the cited 30 October 2026 market snapshot, Babcock traded at 1,024p, with a £5.0 billion market capitalisation and a trailing P/E of 25.04x. This is context rather than a valuation target; a trailing multiple cannot capture programme risk, debt, cash conversion or future contract economics on its own. (London Stock Exchange Group, 2026) ↗
**What would strengthen the case:** finalisation and mobilisation of support agreements; further Royal Oak-related awards; stable or improving margin; and free-cash-flow progress without sacrificing needed investment.
**What would weaken it:** another material programme provision, repeated slippage in naval-support conversion, declining backlog without a compensating improvement in quality or margin, or cash generation lagging reported profit.
Chemring: capacity is an asset only if utilisation and cash follow
Chemring offers a more direct exposure to the industrial replenishment cycle, particularly through energetics. Its interim results reported a record £1.4 billion closing order book, 6.5% revenue growth and £44 million of capital expenditure on energetics expansion. It said that 91% of expected 2026 revenue had either been delivered or was within the order book. The same update reported net debt of £144.5 million and net debt to underlying EBITDA of 1.47x, up from 0.98x a year earlier. (Chemring Group, 2026) ↗
This creates a clear trade-off. Building specialist capacity ahead of demand can be strategically valuable where customer qualification, safety requirements and technical expertise limit entry. It can also establish the supply base needed for more resilient UK and allied production. However, the economic benefit depends on commissioning and utilisation. If ramp-up is delayed, demand is rescheduled or input costs rise, capital expenditure and higher leverage arrive before the hoped-for earnings and cash benefit.
At the cited 30 October 2026 market snapshot, Chemring traded at 566.5p, with a £1.55 billion market capitalisation and a trailing P/E of 33.01x. That valuation measure should be treated cautiously, but it does indicate that the market was already attaching value to structural demand and successful execution. (London Stock Exchange Group, 2026) ↗
**What would strengthen the case:** conversion of the order book into revenue, timely facility commissioning, improving cash generation after capital expenditure and leverage stabilising as earnings rise.
**What would weaken it:** persistent delay in capacity ramp-up, reduced utilisation, debt increasing faster than operating profit, or a failure to deliver the second-half weighting identified at the interim stage. The central question is not whether energetics demand exists; it is whether Chemring can convert that demand into returns on the capital now being deployed.
QinetiQ: readiness spending also requires testing, assurance and integration
QinetiQ represents a different mechanism: test, evaluation, training and mission assurance rather than high-volume production. Its FY26 results reported £3.573 billion of order intake, £4.421 billion of funded backlog, an 11.3% underlying operating margin and £159 million of free cash flow. Management guided to FY27 revenue growth of 3–5%, an 11.0–11.5% operating margin, EPS growth of 8–10%, cash conversion above 90%, and more than £550 million of free cash flow across FY27–FY29. These are company targets, not independent forecasts. (QinetiQ Group, 2026) ↗
Its £1.7 billion Long Term Partnering Agreement extension to 2033 is strategically significant because a more technologically complex force requires systems to be tested, assured and integrated before operational deployment. That can make testing infrastructure an enabling layer of rearmament, rather than an indirect beneficiary of it. (QinetiQ Group, 2026) ↗
The risk is that this is a more nuanced exposure than a simple procurement-volume story. Its value rests on estate utilisation, technology relevance and delivery against margin and cash targets. QinetiQ is also assessing the strategic fit of its US business, creating an additional capital-allocation and execution variable. (QinetiQ Group, 2026) ↗
**What would strengthen the case:** progress against FY27 margin and cash-conversion guidance, awards linked to the extended partnering agreement and evidence that next-generation programmes are using its test-and-evaluation capability.
**What would weaken it:** funded backlog failing to translate into margin and cash, material disruption from US portfolio actions, or limited evidence that its facilities are capturing demand from autonomy, electronic warfare and digital assurance.
Scenarios to October 2028: timing, not direction, is the main uncertainty
**Base case — selective conversion.** Defence expenditure continues to rise, but awards and revenue recognition are uneven. Companies with funded work, differentiated capability and credible cash discipline outperform businesses relying principally on thematic association.
**Upside case — faster industrial mobilisation.** Procurement reform, supply-chain investment and international co-operation shorten the period between policy commitment and contract award. This would favour qualified capacity in naval support, energetics and testing infrastructure. Budget 2026’s emphasis on industry delivery and procurement reform makes this plausible, but not assured. (GOV.UK, 2026) ↗
**Downside case — commitment is sustained but conversion disappoints.** Fiscal trade-offs, skills constraints, affordability reviews or programme complexity delay orders and customer acceptance. In that outcome, suppliers that have expanded capacity or returned capital ahead of cash generation could face the sharpest pressure. Importantly, this scenario does not require defence policy to reverse; it requires delivery to be slower or more costly than valuations and management plans assume.
These are Sanctuary scenarios, not forecasts or investment recommendations. Market-price data are time-sensitive, and company results are management disclosures. Readers should not treat the quoted P/E ratios as comparable rankings or as sufficient evidence for an investment decision.
The wider UK implication: build capability around verified demand
The defence opportunity has an operational counterpart for SMEs, local authorities and larger contractors. A greater volume of defence activity can support regional supply chains, technical employment and specialist services, but it will not automatically do so. Small firms may face qualification requirements, long sales cycles, security constraints and working-capital exposure before work becomes repeatable revenue.
**Sanctuary recommendation:** organisations considering defence-adjacent growth should use a staged readiness plan. First, identify specific customer programmes and credible tier-one routes to market. Second, assess technical qualification, governance, workforce and finance requirements. Third, stress-test the cash impact of delayed acceptance or slower mobilisation. Capital should be committed against validated customer pathways, not simply a large aggregate spending figure.
This approach also improves local economic value. The most resilient investments are capabilities with relevance beyond one programme: advanced manufacturing, engineering assurance, digital security, project controls, maintenance and workforce development. That does not eliminate defence-cycle risk, but it reduces dependence on a single procurement decision and creates a stronger basis for productivity and employability gains.
The analytical discipline is straightforward: follow funded awards, delivery milestones, margin after programme charges, cash conversion after capital expenditure, leverage, workforce capacity and customer acceptance. Those indicators will reveal more about the UK defence opportunity to 2028 than another rise in the spending headline.
Research foundation
References
- Ministry of Defence and HM Treasury (2026). The Defence Investment Plan. GOV.UK.Source ↗
- HM Treasury (2026). Budget 2026. GOV.UK.Source ↗
- Office for Budget Responsibility (2026). Economic and fiscal outlook – October 2026. GOV.UK.Source ↗
- Babcock International Group (2026). AGM trading update, 16 September 2026. Babcock International Group investor news.Source ↗
- Babcock International Group (2026). Full year results for the year ended 31 March 2026. Regulatory News Service, London Stock Exchange.Source ↗
- London Stock Exchange Group (2026). Babcock International Group Plc equity price and quote. London Stock Exchange, Market data closed 30 October 2026.Source ↗
- Chemring Group (2026). Interim results for the six months to 30 April 2026. Chemring Group investor relations.Source ↗
- London Stock Exchange Group (2026). Chemring Group Plc equity price and quote. London Stock Exchange, Market data closed 30 October 2026.Source ↗
- QinetiQ Group (2026). FY26 Group Performance. QinetiQ investor news.Source ↗
- Lewis Clarke. Hero image: Plymouth , Trafalgar Submarine at Devonport Naval Dockyard - geograph.org.uk - 1151394.jpg. Wikimedia Commons · CC BY-SA 2.0.Image source ↗
Related Sanctuary capabilities
From analysis to implementation.
Discussion
No approved comments yet.